Alexander Tsepkov Project Portfolio
Software developer and data geek with 18+ years delivering web, mobile, and defense systems that ship to production. My focus is on analytics platforms, APIs and developer tooling. My open-source work ranges from compilers and automation frameworks to GIS data products. I weave AI-assisted workflows into day-to-day engineering to accelerate delivery and quality.
Basket of Goods
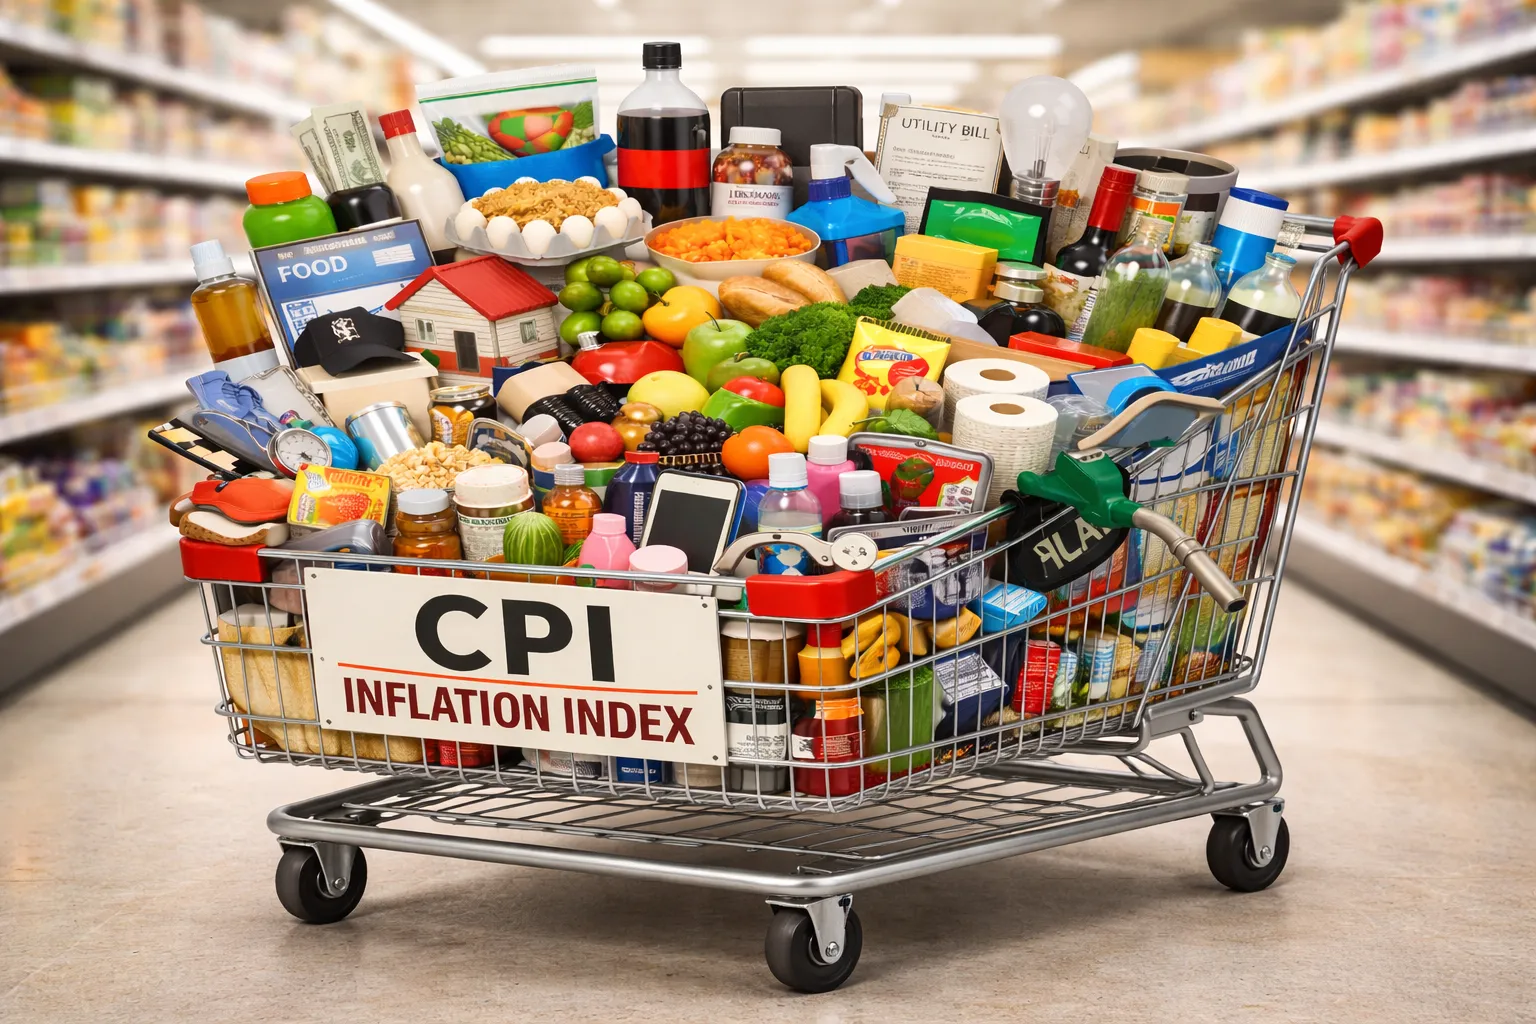 Inflation has been on top of everyone's mind over the last few years. It's a concept that historically has been foreign to Americans due to the relative stability of the US dollar but all too familiar to the rest of the world. The U.S. Bureau of Labor Statistics is the official source for inflation data (Consumer Price Index). It measures inflation through what's known as "basket of goods": a hypothetical basket of ~80,000 goods and services, weighed by their importance to an average urban consumer. This approach, however, is not without flaws:
- Substitution bias: As consumers change their behavior, the CPI basket of goods reshuffles itself to better capture this change. The problem is that CPI does not track the cause. If middle class suddenly starts preferring chicken over the more expensive beef, that event is seen as deflationary (ignoring the fact that consumers are buying chicken because they can no longer afford beef). Similarly, if airfare spikes and people start driving instead, the CPI will count that shift as a reduction in travel costs - even though people are spending more time, gas, and lodging to get where they’re going. Substitution bias isn’t just a statistical artifact. It’s a deliberate modeling choice. The government could choose to fix the basket or use other reference points, but it doesn’t, because shifting the basket downward makes inflation appear more moderate. The erosion in quality of life doesn’t show up in the numbers.
- Housing and rent lag: A big part of the CPI is housing (rent and “owners’ equivalent rent” of owned homes). These components change only when leases roll over, so official inflation data can lag what’s happening in the housing market. In 2023, for example, falling gasoline prices helped keep headline CPI flat, even as rents and housing costs kept climbing.
- Quality adjustments (“hedonics”): When products improve (say, a new smartphone or car has better features), the CPI counts part of the higher price as an increase in quality, not inflation. In practice this means a new $1,000 laptop with much faster performance might be treated as costing less than the old model, because it’s better. The Bureau of Labor Statistics (BLS) tries to adjust for quality changes – a complex “hedonic” process - which masks real price increases. The fact that your iPhone today has 2X more features than phones from a decade ago doesn't mean that you have the option to only buy half of an iPhone.
Together, these factors mean that the official CPI approach underestimates true inflation, especially when it's high enough to influence consumer behavior (as we've seen during COVID). As goods become unaffordable, people have to look for alternatives - not because their preferences shifted, but because they have no other choice. Indeed, many economists agree that “true” cost-of-living increases have been higher than what CPI suggests. Even BLS itself acknowledges that post-1996 formula changes (like substitution and quality rules) have lowered reported CPI growth by about 0.2–0.3 percentage points per year - a figure that, like the inflation itself, is probably understated.
Alternative Measurements and Motives
There are other approaches to measuring inflation, each with unique strengths and weaknesses. Officials and politicians often point to the measure that suits their narrative. For example:
- Core vs. headline inflation: Headline CPI includes everything, including volatile food and energy prices. Core CPI excludes food and energy, focusing on the “underlying” trend. Policymakers often emphasize core inflation (because it is steadier), but consumers don’t get to avoid paying for food and fuel. If gas prices spike, headline inflation jumps. But officials often cite core CPI instead, which downplays the real inflation experienced by the consumer. This also allows them the claim that "inflation is transient", which we've been hearing a lot over the last few years. As of October 2023, headline CPI is about 3.2% higher year-over-year, but core inflation is still around 4.0%. Both are far above the 2% Fed target.
- CPI vs. PCE: The Federal Reserve’s preferred inflation gauge is the Personal Consumption Expenditures (PCE) index, not the CPI. The PCE has a broader scope (it counts some spending CPI misses) and updates its weights more frequently to reflect substitutions. Historically PCE inflation runs lower than CPI inflation - roughly by about 0.5 percentage points on average. For example, in summer 2022 CPI was near 9% year-over-year while PCE was closer to 7%. Since 2000 CPI has risen about 39%, while PCE rose 31%. By using PCE as its benchmark, the Fed’s 2% target understates price growth relative to CPI. Meanwhile, Social Security COLAs and many contracts use CPI (or a variant, CPI-W), so those rise faster. The choice of index has big effects on budgets and policy.
- Chained CPI (C-CPI-U): The BLS also publishes a “chained CPI” that explicitly updates spending weights after prices change. This chained index accounts for consumers switching away from big-price-increase items across categories. As a result, the chained CPI almost always runs a bit lower than the standard CPI. Many deficit-cutting proposals rely on chained CPI to index taxes and benefits, because it grows more slowly. While chained CPI may reflect substitution more accurately, its drawback is that it yields smaller inflation adjustments for fixed incomes (a political concern).
- Median or trimmed inflation: Some economists use median or “trimmed mean” measures to filter out volatile outliers. For example, the Federal Reserve Bank of Cleveland’s median CPI is the middle price-change of all CPI components each month (dropping the largest rises and falls). Likewise, Dallas Fed’s trimmed-mean PCE removes the upper and lower tails of price changes. These methods aim to capture the core trend better. By omitting extreme jumps or crashes, they often give a steadier inflation signal than even core CPI. The Cleveland Fed finds its median CPI “provides a better signal of the underlying inflation trend” than headline CPI or core CPI. Their drawback is simply that they ignore real, legitimate price swings - downplaying inflation’s impact on goods that really are rising fast.
- Other measures: Private analysts sometimes cite alternative indexes. For example, the Billion Prices Project (MIT) scrapes thousands of online prices for a real-time inflation gauge. Or some point to commodity/producer price indexes as early warnings. There’s even the contrarian “ShadowStats” website that re-computes CPI using old 1980s methods to show much higher inflation (often double the official rate). These can highlight how methodology changes affect results.
Inflation in 2021–2023: An Example
The inflation surge of 2021–2022 illustrates these issues. As economies reopened after the pandemic, prices rose rapidly: CPI inflation peaked at 9.1% year-over-year in June 2022 – the fastest pace in 40 years. Key drivers were energy (gasoline prices were up ~60% over the year) and food (groceries up ~12%). Core inflation (excluding food and energy) also climbed to around 6%–7%. The public felt the pinch at grocery stores, gas pumps and rent.
Yet by late 2023, official inflation reports told a different story: CPI had fallen to about 3.2% (Oct 2023, YoY). Policymakers celebrated the slowdown, noting that even core CPI had eased. But many consumers still faced steep costs. In October 2023 the CPI was flat for the month because a 5.0% drop in gasoline prices was offset by rising rents and other costs. If your lease had just renewed or you hadn’t bought gas yet, your personal inflation might have been much higher. In fact, owners’ equivalent rent (a CPI measure of housing) was still rising strongly at that point. Despite the headline cooldown, households on tight budgets often felt inflation remained tough.
This case shows the gap: official data trended down, but underlying pressures (housing costs, services, etc.) stayed high. Experts point out that CPI may lag in reflecting these. For example, one analysis noted that even when CPI inflation seemed to pause, underlying goods and services prices were still growing rapidly. (The Federal Reserve took note and started looking at “sticky” inflation measures excluding housing in late 2023.) The lesson: an average number like CPI can miss what’s happening in different price categories and time lags, so “inflation” in everyday life often feels worse than the headline suggests.
Why Politicians Use Low Inflation Numbers
Why might the government prefer the CPI (or a related index) to report lower inflation? One practical reason is budgetary: many taxes, benefits and contracts are indexed to inflation. If official inflation is under estimated, the government pays out less in cost-of-living raises and collects more real tax revenue (since thresholds rise more slowly). For example, Social Security COLAs are tied to CPI-W. A lower CPI means smaller benefit increases next year. Likewise, tax brackets generally rise with inflation, so lower reported inflation keeps more income in higher tax brackets. Lower inflation also means government debt erodes more slowly in real terms, and monetary policy can stay looser (beneficial to borrowers, including the Treasury). Lower inflation numbers can make deficits and debt easier to manage.
While the US government doesn't openly falsify data, we definitely see that there are incentives to measure inflation differently depending on context - and many of these incentives are self-serving (e.g. higher budget, more tax revenue). Of course, there are arguments on both sides. Back in 1996, some economists argued CPI overstated inflation due to old methods. Today many focus on underestimation. The Federal Reserve walks a tightrope: admitting inflation is worse than reported risks market panic and consumer distrust; underreporting risks credibility erosion. In this environment, a ‘moderate’ CPI becomes the path of least resistance.
Regardless of whether you think the understated inflation is benign byproduct of government's approach to measuring it or intentional misrepresentation (either to prevent public panic, collect more taxes, or appear to have a stronger financial position), inflation is a fact of life. If you ignore its impact on your investing, you're swimming against the current. Real estate is the only asset class that not only keeps up with inflation, but actively benefits from it. Rather than trying to fight against something outside of your control, a prudent investor plays the game where inflation works as the tailwind rather than the headwind.
Related posts